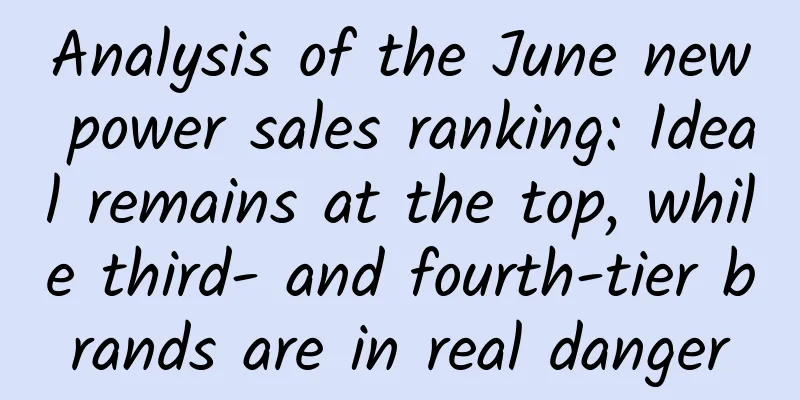
As we enter the second half of the Internet era, competition for Internet traffic is becoming increasingly fierce. How can we stand out from the crowd and achieve user and revenue growth? Retention is crucial in this process. Today's open class mainly teaches you how to interpret retention data, build a retention analysis framework, effectively implement user operations , and improve user retention rate through some specific user cases. 1. Why should we pay attention to retention? Retention, as the name suggests, means that users stay on your website/App and continue to use it. Common retention indicators include next-day retention, seven-day retention rate , next-week retention rate, etc., which indicate the proportion of target users who return to the product or return to the product to complete a certain behavior after a period of time. If the product cannot retain users, our product is like a hollow basket. The more water we pour in, the more water will flow out, which means that our product cannot achieve sustainable growth. If you want to achieve sustainable growth of a product, user retention is a very important indicator. Retention has a long-term impact on active user growth . Here we specifically simulate a product growth situation. Suppose a product acquires 100 new users per week, and the next-week retention rate of new users is 60%. In the figure on the left, the absolute value of the next week retention rate of users decreases by 3% every week, that is, the retention rate this week is 60%, the retention rate next week is 57%, and so on. In the picture on the right, the absolute value of retention rate decreased by 1%. The weekly active users consist of new users this week and old users who have remained in the previous week. After 29 weeks, the previously retained old users in the left figure have basically decayed to 0, while in the right figure we can see that some of the earliest users are still able to stay after 29 weeks. Comparing the two situations, their new user acquisition volume is the same, and the retention rate is only 2% different in absolute value, but after 29 weeks, the ratio of user volume is 1:2. This chart vividly illustrates the importance of retention rate to the growth of active users. 2. Retention Analysis Framework When conducting retention analysis, we should learn to break down the problem more often, breaking down the big goal of "improving retention" into small executable goals. We can then improve user retention through product optimization, operational adjustments, and other methods. In our common retention curve, different retention stages are usually divided according to the user's journey.
In the short term, we focus on user activation. During this stage, we need to enable users to quickly and cost-effectively feel the core value of the product and quickly reach the "aha moment".
In the mid-term stage, we focus on improving the retention of old users. At this stage, we need to build the core functions of the product and cultivate users' usage habits for the product.
In the long term, we need to think about what the long-term value of the product is to users and how to allow users to repeatedly experience the value of the product.
When optimizing retention, only by doing a good job of retention analysis and improvement at each stage can the overall retention curve be improved.
3. Case Analysis Next, we will analyze two specific cases to explain how we should interpret retention data and improve user retention in different application scenarios. 3.1 Case 1: Lowering the cost of getting started for new users and improving new user retention There is a pan-entertainment app that mainly provides content consumption for users and has certain social attributes. Therefore, the number of daily active users and the number of retained users are very important. Based on the current retention data of this product, the product team believes that there is still a lot of room for improvement in their new user retention and wants to find the focus of growth through data analysis .
(1) Understand the current status of new user retention
First of all, we need to understand the retention status of new users for analysis, because for product managers , evaluating the status of a product is an unavoidable step before optimizing the product.
By comparing the retention curves of new visiting users and all visiting users, we will find that the retention rate of new users is significantly lower than that of all users. From this perspective, the retention rate of new users is a major growth point. We just mentioned that for new users, the Onboarding activation process is very important. Whether users can quickly and cost-effectively perceive the value of a product when using it for the first time determines the activation rate of new users. (2) Determine the activation target
When talking about activation, we often talk about the "Aha Moment", which is the moment of surprise when users discover the core value of the product and generate the motivation for repeated use. The "Aha Moment" of different products is also different. For example, LinkedIn is to add 5 social connections in a week, and Facebook is to add 7 friends in 10 days.
Product managers need to find users’ Aha Moment based on their products and help users realize the product value as quickly as possible. First, we need to know which features may make new users feel the value of the product. We can use GrowingIO's retention analysis function to analyze and compare the retention rates of users who have used different features to find the product features with the highest retention rate.
By comparing the retention rates of different functions, we can find the functions that have a significant increase in retention rate after new users use them. Then, based on the high or low cost of getting started with the functions for new users, we can further narrow the scope and determine the activation targets for new users. (3) Evaluate the activation status of new users After determining the activation goals, we can start evaluating the activation status of new users and conduct targeted operations for different users. In this case, 30% of new visitors are not activated. For this part of users, what we need to do is to improve the activation rate; for the remaining activated new visitors, the optimization direction is somewhat similar to that of old visitors, that is, how to improve retention and let them continue to use the product.
The channel is the starting point of the user journey. New users coming from different channels will have certain differences, and their access intentions or goals may not be consistent. Therefore, we can look at the new user activation status of different channels. Here we can look at the differences between users from different channels from the perspective of new user activation ratio and retention rate.
It can be found that some channels have both low activation rate and retention rate, which may be because the channel population has a low match with the product demand. In this case, the channel needs to be adjusted more. Some channels may have a low activation rate but a slightly higher activation retention rate than the overall. In this case, the channel users may be more accurate, which requires further research on business data. (4) Impact of activation time and retention For inactive new users, when is the activation time more important? What impact do inactive users have on retention? From the picture above, we can see that the activation time for new users should be as soon as possible. The green curve represents new users who were activated on the same day, and the red line below represents new users who were not activated on the same day. It can be found that the retention rate of the red line is very, very low. That is to say, if a new user does not complete the activation behavior on the first day of using the product, then the possibility of his loss will be very high, basically it is assumed to be lost. So when we talk about activating new users, it basically means that the users can complete core behaviors and recognize the core value of the product on the day they enter the product. (5) Analysis of new user activation function
How to increase activation of new users within the product? Before asking this question, we can think about why new users are not activated and where they are lost? In this way, we can find the key steps of user loss and optimize them.
We can build a funnel based on the main path of new user activation. Through the conversion data of each step of the funnel, we can locate the main loss links of new user activation, and further analyze the reasons for loss by combining tools such as user segmentation and detailed investigation. In the first major loss link, we use user segmentation to filter out new users who have not been activated in this link. By checking the behavioral trajectories of these new users in detail, we can find that more than half of the visitors are lost in the registration and login links. From the typical user behavior trajectory, we can find that many users are stuck at the login and registration step, and they have never touched the actual activation link. So for the activation optimization of these users, we can advance the activation steps so that they can see the content as soon as they come in, without the need to register/log in.
In the second major loss link, we found that a small number of users have reached the list page, that is, they have reached the actual activation step, but they did not click on the specific content. Is it because the list content is not attractive enough to users? This list is composed of multiple contents such as user attention and product recommendations. It may be that there are fewer contents generated by user attention in the list. In this case, we need to better guide the attention behavior and increase the attractiveness of the content to users.
In response to this kind of loss, we made an adjustment to the product to advance the activation step, and found that the retention rate of new users has been significantly improved. But specifically, half of the visitors who had not been exposed to the actual activation steps have been successfully activated, and the retention rate of new users after the launch has also increased significantly.
3.2 Case 2: Evaluate product function value and find room for retention improvement
There is a vertical information product that provides three modules of functions: free or paid content and interaction for different user groups. The product has many subdivided functions, and there is still room for improvement in overall user retention. Therefore, we need to understand the value of the main functions through data analysis, find the room for improvement of each function, and improve overall user retention through function optimization.
(1) Product feature retention matrix
In order to gain insight into the overall module roles of the product, explore the value positioning of each function, and understand which functional modules are in high demand and which functional modules have high penetration rates, we need to build a product function retention matrix.
The horizontal axis of the matrix is the function retention rate, which indicates the user stickiness of the current function; the vertical axis is the proportion of active users, which indicates the number of users using the current function in a certain period/the number of active users in that period. After making such a matrix, we can see the distribution of different functions in the matrix. A successful product feature should have two characteristics: being used by more users and having high user stickiness. That is, it is located in the upper right corner of the matrix. But anyone who has made this matrix should be able to find that most functions are located in the upper left or lower right, and some functions are even in the lower left. The functions located on the upper left have a high proportion of active users but low retention. These functions may not meet user needs or make users realize their value. The functions located on the lower right have too few users. Therefore, a simple strategy to improve retention is to increase the frequency of use of high-penetration and low-frequency functions and increase the penetration rate of high-frequency and low-penetration functions. Allow each function to be moved to the appropriate position in this matrix.
Of course, each function should be designed with its usage scenario in mind. In this case, we divide the functions in the matrix into four categories based on specific product functions:
Popular functions: large exposure and high usage rate, such as the search function in many products. For this type of function, we need to understand the user's usage and find room for improvement.
Core functions: are related to delivering product value to users. They have low user usage rates and higher function retention rates than popular functions. We should look for high-value functions in core functions, and we promote the usage rate of these functions to increase user retention and explore growth breakthroughs.
Niche functions: Functions with moderate retention but low user usage rate can be used to find functions with potential for optimization.
Other functions: These “low-quality” functions can be appropriately optimized based on our resource status.
When optimizing, in addition to focusing on core functions, we further pay attention to functions that have higher activity and retention than core functions, and look for new improvement opportunities in these functions.
In our daily work, after a certain period of time or when there are major changes in product functions, we can make such a matrix to understand the transfer of users' use of product functions, or observe the performance of new functions in the product. Of course, we can also look at the product function matrix of different user groups. Generally, new and old user groups or user groups with different attributes will have different performances. We can locate what operations of different user groups should pay more attention to.
(2) Case analysis
With such a matrix, the next thing to do is to break down each type of function one by one and find room for optimization in retention. Below we will select some examples of the four types of functions in this case and analyze them.
1) Public function: daily information
There is a daily news in the public function module. We can find some findings from the data:
The next-day retention rate of users who clicked on the daily information function on the homepage is lower than that of all users. The difference in retention rates between the two can be considered as room for improvement of this function.
From the perspective of the page, the closer and higher the layout is, the higher the user views and click-through rate will be.
For the daily information module, the next-day retention rate increases linearly with the number of information browsed that day. We can find that most users browse less on the same day, but the more users browse, the better the retention will be the next day.
Based on these findings, we can do some tests, such as reducing the size of the page header area and increasing the exposure of daily information. It is hoped that such adjustments will increase the click-through rate of daily news and expand the coverage of news reading, thereby increasing the user retention rate on the next day.
2) Core function: record content
There is a "record content" in the core function module. From the matrix, we can see that the recording function has a higher retention rate; at the same time, from the retention curve, the next-day retention rate of the "recording function" is significantly higher than that of the "daily information". So we may need to think about what is the core value of this function?
You can make a funnel to understand the user usage process. In this funnel, two links need to be paid attention to: one is how to allow more people to access this function; the other is how to allow users who access this function to truly participate in its use.
Regarding the penetration of users into functions, from the perspective of function retention rate, it may be necessary to adjust the timing of function promotion. For example, is it possible to promote the function after the user logs in so that the user can enter?
For users who complete the function after entering it, we need to further break down which link affects the user's completion of this function? Is it a question of functional identification or process experience? We need to find the weak links and then optimize them accordingly.
Therefore, for this function, we can do some tests, such as advancing the timing of promoting the function and strengthening function guidance; and optimizing the weak links in the use of the function in a targeted manner, so as to increase the number of users using this function.
3) Other features: paid content
There is a paid content in the other function modules, and the user usage rate and retention rate of this function are not high. Paid content users can click in from the homepage and discovery sections. We can see from the bar chart on the left that most users click in from the homepage. So is there a difference in the retention of users who click on paid content through different entrances? If so, can we adjust the proportions of content in different locations accordingly? There are also different types of paid content. In the retention chart on the right, you can see that the retention of users who click on different types of paid content will also be different, and the user coverage also varies. Some paid content may be more attractive to users, so we can also make some adjustments to the ratio of paid content types.
4) Niche function: Selected topics
There is a featured topic in the niche function module. Compared with the overall retention rate, the user retention rate of each featured topic is slightly lower, but the function retention rate is slightly higher. Is it because there are fewer people in need of this function, but the function has higher stickiness for users who need it?
The number of people using the selected topics is much less than that of the daily information of the [Public Function], but the next-day retention rate is not significantly different from that of the daily information, which is a normal data fluctuation. Can we monitor this retention rate over a long period of time to see if there are any abnormalities? At the same time, whether there are differences in different topic contents, we can conduct in-depth exploration of potential functions or content and make appropriate optimizations.
The second case mainly uses the product function matrix to understand the functional positioning, and then looks for possible improvement space for each type of function.
To review, there are two main ways to improve user retention: one is to improve the retention rate of new users, and the other is to improve the retention of different product features. Only through continuous optimization and testing can the goal of improving retention be achieved.
The author of this article @邹婧琳GrowingIO compiled and published by (Qinggua Media). Please indicate the author information and source when reprinting!